
Overview
Use Dashboard Analytics for overall usage and results. Use User Activity to see who is sending messages and completing tasks.
1. Open Dashboard Analytics
1) Open the Dashboard Screen, Analytics Tab
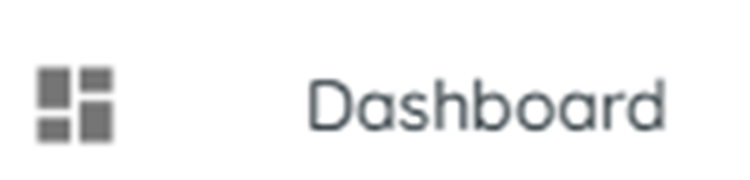
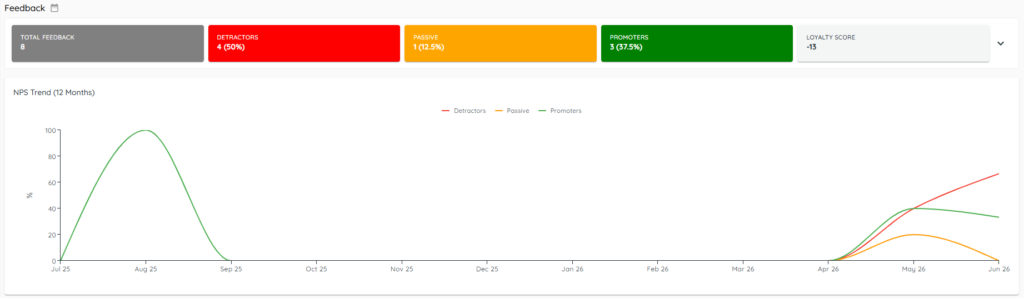
You’ll see survey responses totaled, and tracked over time.
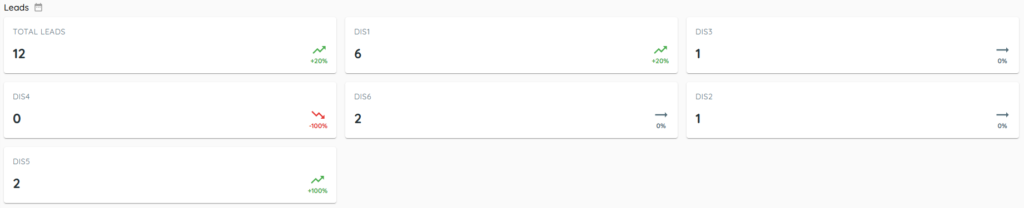
You’ll see Leads received, tracked by store.
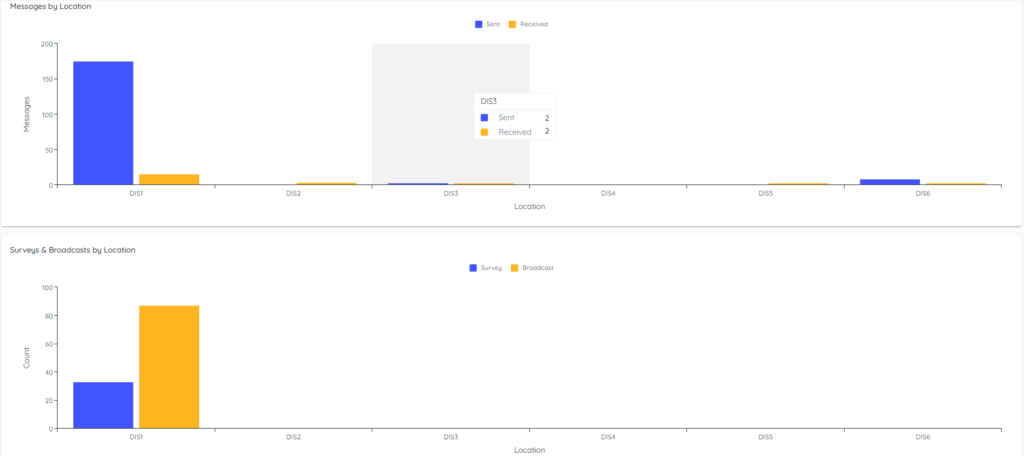
You’ll see messages used, tracked between stores, and broken out into Surveys and Broadcasts.
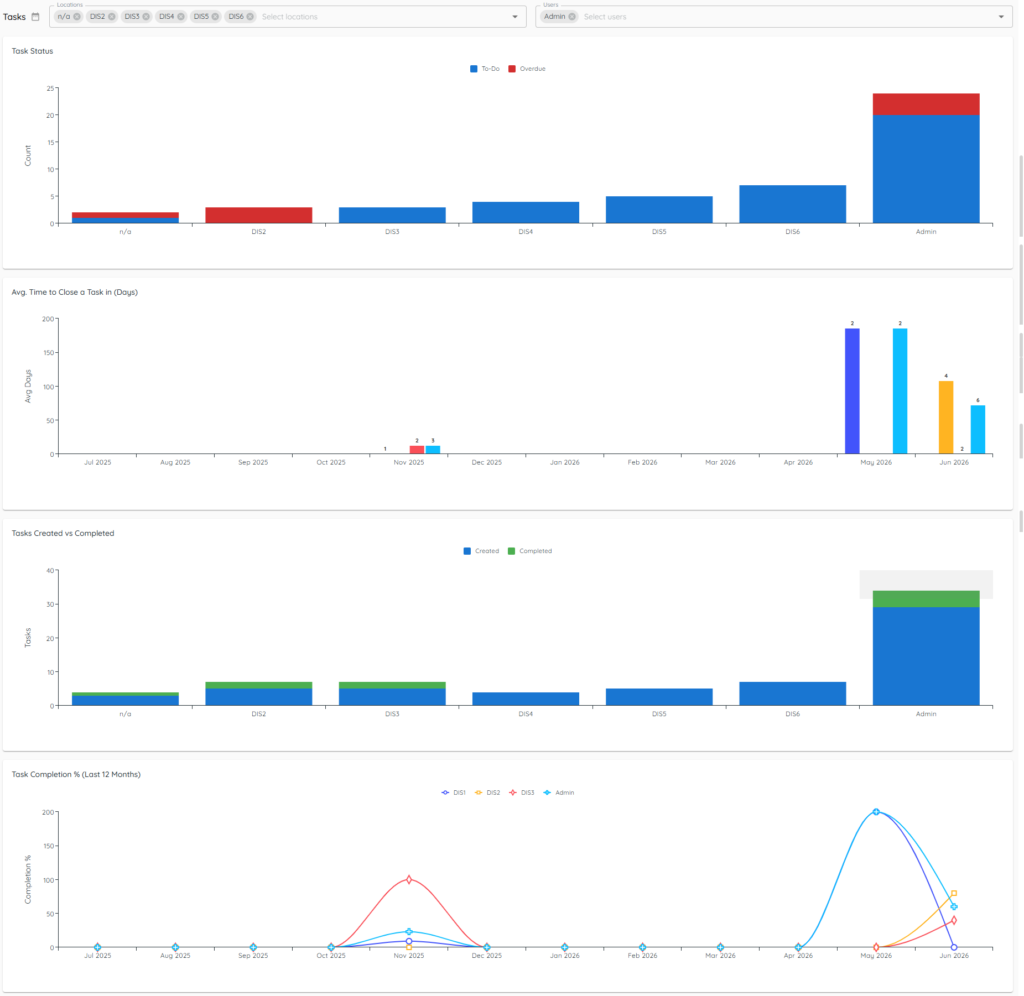
The Tasks section will break down task usage by selected store location(s), and selected user(s).
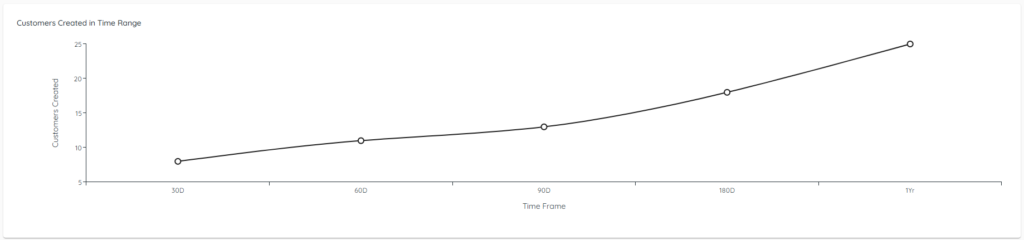
At the bottom of the screen you will see Customer Creation tracked over time:
Adjust calendars in the top right corner to change the date range (resets to last six months after you leave).
2. Review Detailed Analytics statistics.
1) Click Detailed Analytics.
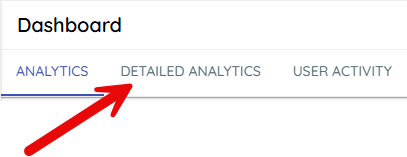
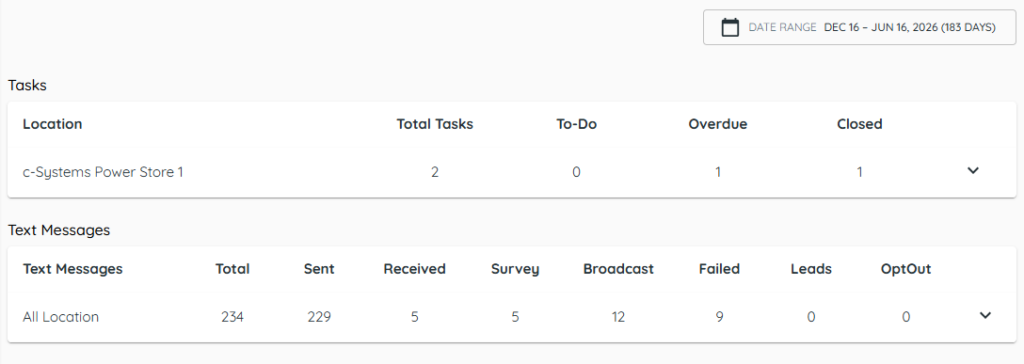
You’ll see Task usage and Text Messages used over the date range listed in the top right corner. These hard numbers can easily be broken up by store and department.
3. Review User Activity by date
1) Click User Activity.
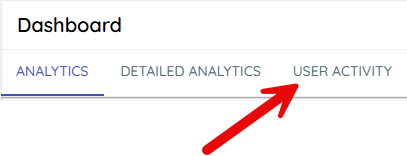
You’ll see messages sent/received and tasks completed.
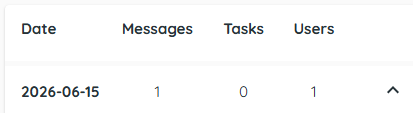
Expand each day to see details.
3. Review User Activity by user
1) Switch to view by user.
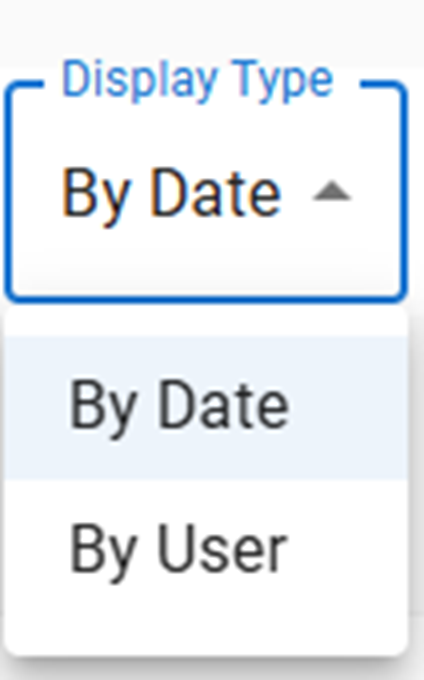
You’ll see totals per user for the selected date range.
Filter to a single user for reviews.
4. Search by keyword
1) Enter a Search keyword to find a message or task.
You’ll see matching entries.
This helps locate exact interactions.
> Tip: If multiple employees share a login (e.g., “Counter 1”), all activity under that shared username aggregates together; use separate logins for clear, individual accountability.
Related KB articles
– Monitor automations: Queue and Analytics
– Mobile app — inventory, customer orders, and task notifications